
Hosted & Managed · EU Infrastructure
Grafana as a Service
Beautiful Dashboards,
Zero Operations
Grafana is the observability layer your clients expect. We host it, maintain it, and keep it secure in our Dutch datacenters — so you deliver premium dashboards without running a single server.

We Operate It. You Visualize Everything.
Grafana is powerful — but hosting and securing it takes time and expertise. We take on the full operational stack so you and your clients can focus on insights, not infrastructure.
 ️
️Provisioned & Pre-Configured
Your Grafana instance is live within hours — pre-configured with data sources, dashboards, and user roles tailored to your MSP environment.

Continuous Updates
Plugin updates, Grafana version upgrades, and security patches — applied automatically, with no downtime. Always on the latest stable release.

Multi-Tenant Dashboards
Create isolated dashboard environments per client. Each client sees only their own data — fully separated, branded, and auditable.

Data Source Integration
Connect to Prometheus, InfluxDB, Elasticsearch, Loki, and more — including your existing Mindtime monitoring stack (Zabbix, CheckMK, RMM).

Secured by Design
SSO, MFA, TLS-everywhere, and role-based access controls — all configured and maintained to ISO 27001 standards from day one.

Automated Reporting
Scheduled PDF/PNG exports of key dashboards delivered to clients automatically. SLA reports, availability summaries, and custom views on demand.
Grafana — The Observability Standard Your Clients Already Expect
Grafana is the world's most popular open-source observability platform. Trusted by thousands of engineering teams globally, it transforms metrics, logs, and traces into clear, actionable dashboards — from infrastructure health to application performance and security events.
As an MSP, offering Grafana dashboards to your clients is a natural upsell. With Mindtime hosting the platform, you skip the ops burden entirely and go straight to value delivery.
Connect any data source: Prometheus, InfluxDB, Loki, Elasticsearch & more
Build client-facing dashboards with your branding and logo
Set up alerting rules with escalation to email, Slack, or PagerDuty
Correlate infrastructure metrics with backup and security events
Compliance-ready audit logs and access records
Part of the unified Mindtime Data Security stack
All dashboard data, metrics, and logs are stored and processed exclusively in Dutch ISO 27001-certified datacenters. No US CLOUD Act exposure. Fully GDPR-compliant under Dutch and EU jurisdiction.
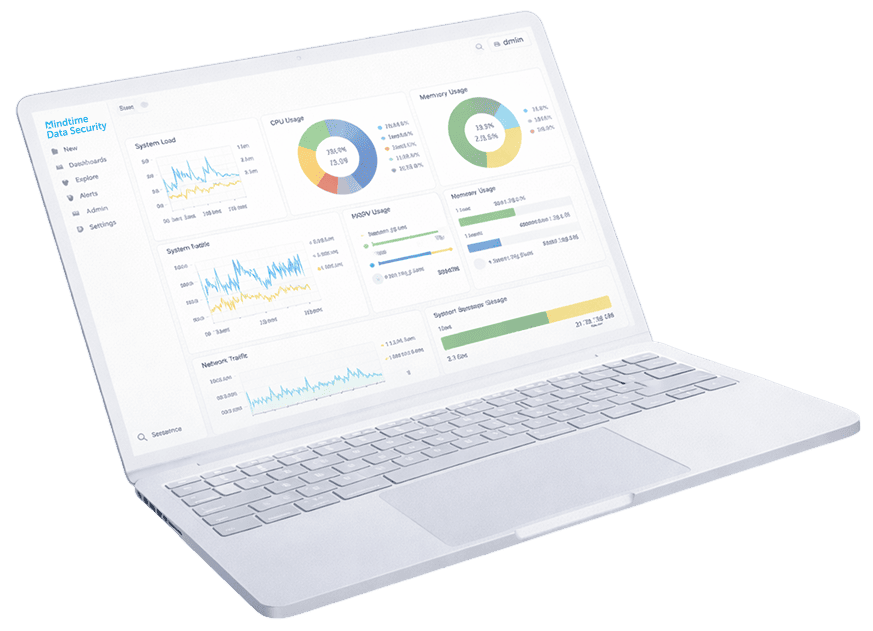
What Your Clients Will See in Their Dashboards
Grafana turns raw data into stories your clients understand. Here's what MSPs typically build with Mindtime-hosted Grafana.
Infrastructure
Server & Network Health
Real-time CPU, memory, disk, and network throughput across all client environments. Immediate visibility into degradation before it becomes an incident.
Data Security
Backup Status & Recovery Metrics
Live backup job status from Mindtime integrations. Visualize backup success rates, restore times, and data protection coverage across your client base.
Compliance
SLA & Availability Reporting
Monthly SLA dashboards your clients can access directly — uptime history, incident count, and response times. NIS2 and ISO 27001 documentation made visual.
Start Offering Grafana Dashboards to Your Clients
Book a call with our team. We'll get your Grafana instance up and connected to your monitoring stack — fast.