

The Downtime Model Your CFO Will Actually Approve
"We need better backup" loses budget battles. "Our tested RTO exposes us to EUR320,000 per incident" wins them - here is the reusable model.

An IT manager requests budget for immutable backup infrastructure. The CFO asks what the current setup costs the company in risk terms. The answer - "downtime is very expensive" - contains no number, no scenario, no comparison, and therefore no decision. The request is deferred to next year. Next year, the same conversation. The year after that, the incident.
The pattern breaks when IT arrives with what finance already uses everywhere else: a risk-adjusted cost model with scenarios, sensitivity ranges, and an ROI delta. Building one takes a spreadsheet and an afternoon; reusing it every budget cycle is what turns continuity from a recurring plea into a standing, quantified line item.
The misconception to retire: RTO and RPO are technical metrics. They are financial variables wearing acronyms - hours offline is revenue and penalties, data-loss window is rework and regulatory exposure. The model's whole job is making that translation explicit.
What Goes Into a Downtime Cost Calculation?
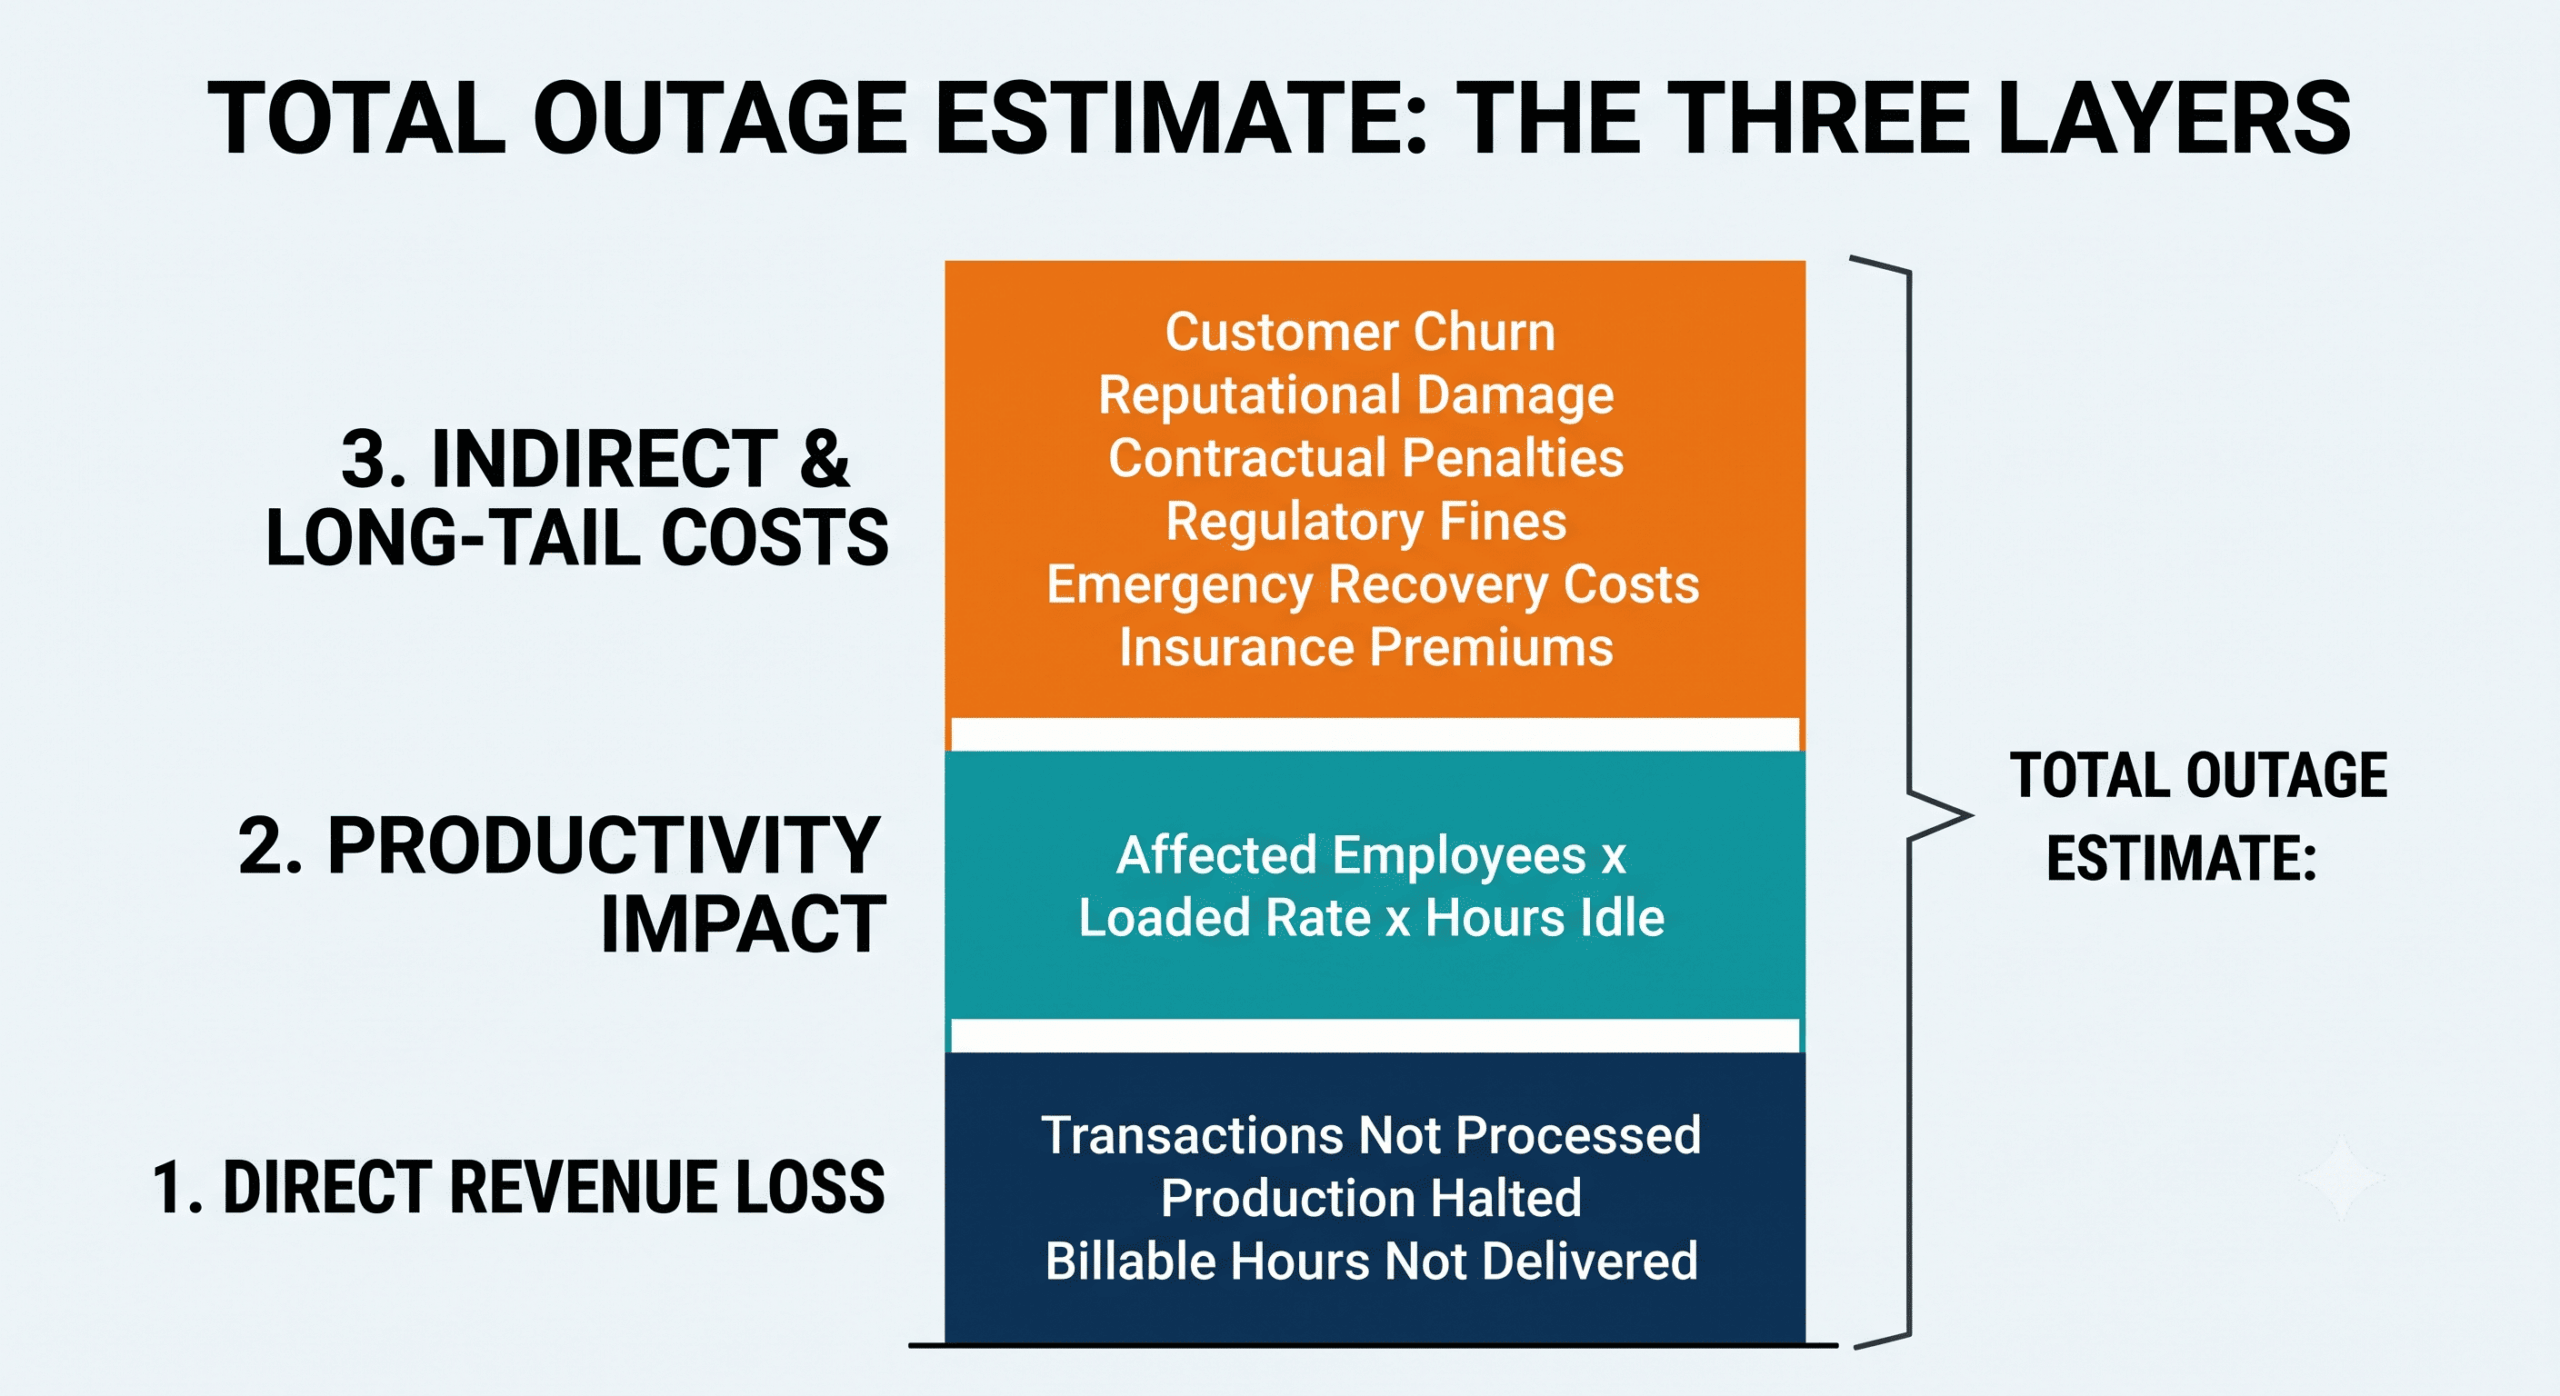
A credible model adds three cost layers, each sourced differently.
The Three Layers
Direct revenue loss. Transactions not processed, production halted, billable hours not delivered. Source: revenue per hour per critical process, from Finance.
Productivity impact. Affected employees x fully loaded hourly rate x hours idle. People are paid during outages; they just can't work.
Indirect and long-tail costs. Customer churn, reputational damage, contractual penalties, regulatory fines, emergency recovery costs, and higher insurance premiums at renewal. Hardest to estimate - use conservative ranges rather than omitting them.
For calibration: ITIC's hourly cost of downtime survey has for years found that over 90% of enterprises face costs above $300,000 per hour, with large organizations and regulated sectors frequently exceeding $1 million. Sector benchmarks are a sanity check, not a substitute - the model only persuades when it runs on your numbers.
Is Downtime Really a Board-Level Number?
Yes - regulation has made it one. The NIS2 Directive requires in-scope entities to implement business continuity measures, naming backup management and disaster recovery explicitly (Article 21), with fines of up to EUR10 million or 2% of worldwide turnover for essential entities that fail. GDPR Article 32 adds the obligation to restore availability of personal data "in a timely manner." Management accountability under NIS2 means these are duties the board carries personally.
That changes the arithmetic of your model: a serious outage without demonstrable continuity measures is not just lost revenue - it is lost revenue plus a potential regulatory penalty plus a harder insurance renewal. Adding the fine range to the operational loss is usually the moment the business case for resilience stops being debatable.
Where the Model Bites: Recovery Time Is the Multiplier
Every cost layer in the model scales with duration, which makes RTO - how fast you can actually restore - the most powerful variable you control. An organization that recovers critical systems in 4 hours instead of 48 doesn't shave its incident cost; it divides it by ten or more.
This is where the downtime model and the backup architecture meet. Ransomware is the scenario that stretches recovery from hours to weeks: if attackers destroy or encrypt your backups, your effective RTO becomes "however long negotiation and rebuilding take." Immutable, air-gapped copies in EU jurisdiction - the foundation of a managed backup-as-a-service platform - are what keep the RTO variable under your control even in the worst scenario, and dedicated ransomware protection removes the "pay or lose everything" branch from your decision tree entirely.
How to Build Your Model: A Five-Step Plan
Get hourly values from Finance. For each critical business process, obtain revenue per hour and the fully loaded cost of the staff who depend on it. Use averages across the working week; note peak periods separately.
Map honest RTO/RPO per system. Record what recovery actually takes today - from the last real test, not from the policy document. Optimistic inputs produce a model the first incident will falsify.
Define three scenarios. Model a 4-hour outage (infrastructure failure), a 24-hour outage (major incident), and a 72-hour-plus outage (ransomware with backup compromise). Assign each a rough annual probability.
Add the regulatory layer. Include the NIS2 fine range and, where personal data is involved, GDPR exposure. Note insurance effects: premium increases or coverage denial following an incident without recovery evidence.
Present expected annual loss next to the cost of closing the gap. Sum (scenario cost x probability) across scenarios, and put the total beside the price of immutable backups and tested disaster recovery. The payback period - often under a year once fines are included - is the slide the board remembers.
A Worked Example
| Current state (tested RTO 12h) | Target state (RTO 4h, immutable) | |
|---|---|---|
| Revenue + payroll loss | EUR240,000 | EUR80,000 |
| SLA penalties | EUR80,000 | EUR0 |
| Regulatory tail risk | up to EUR2M | Materially reduced (evidence on file) |
| Expected cost per major incident | ~EUR320,000 + tail | ~EUR80,000 |
| Investment | - | EUR150,000 (year one) |
| Payback | - | < 12 months at 1 incident/year |
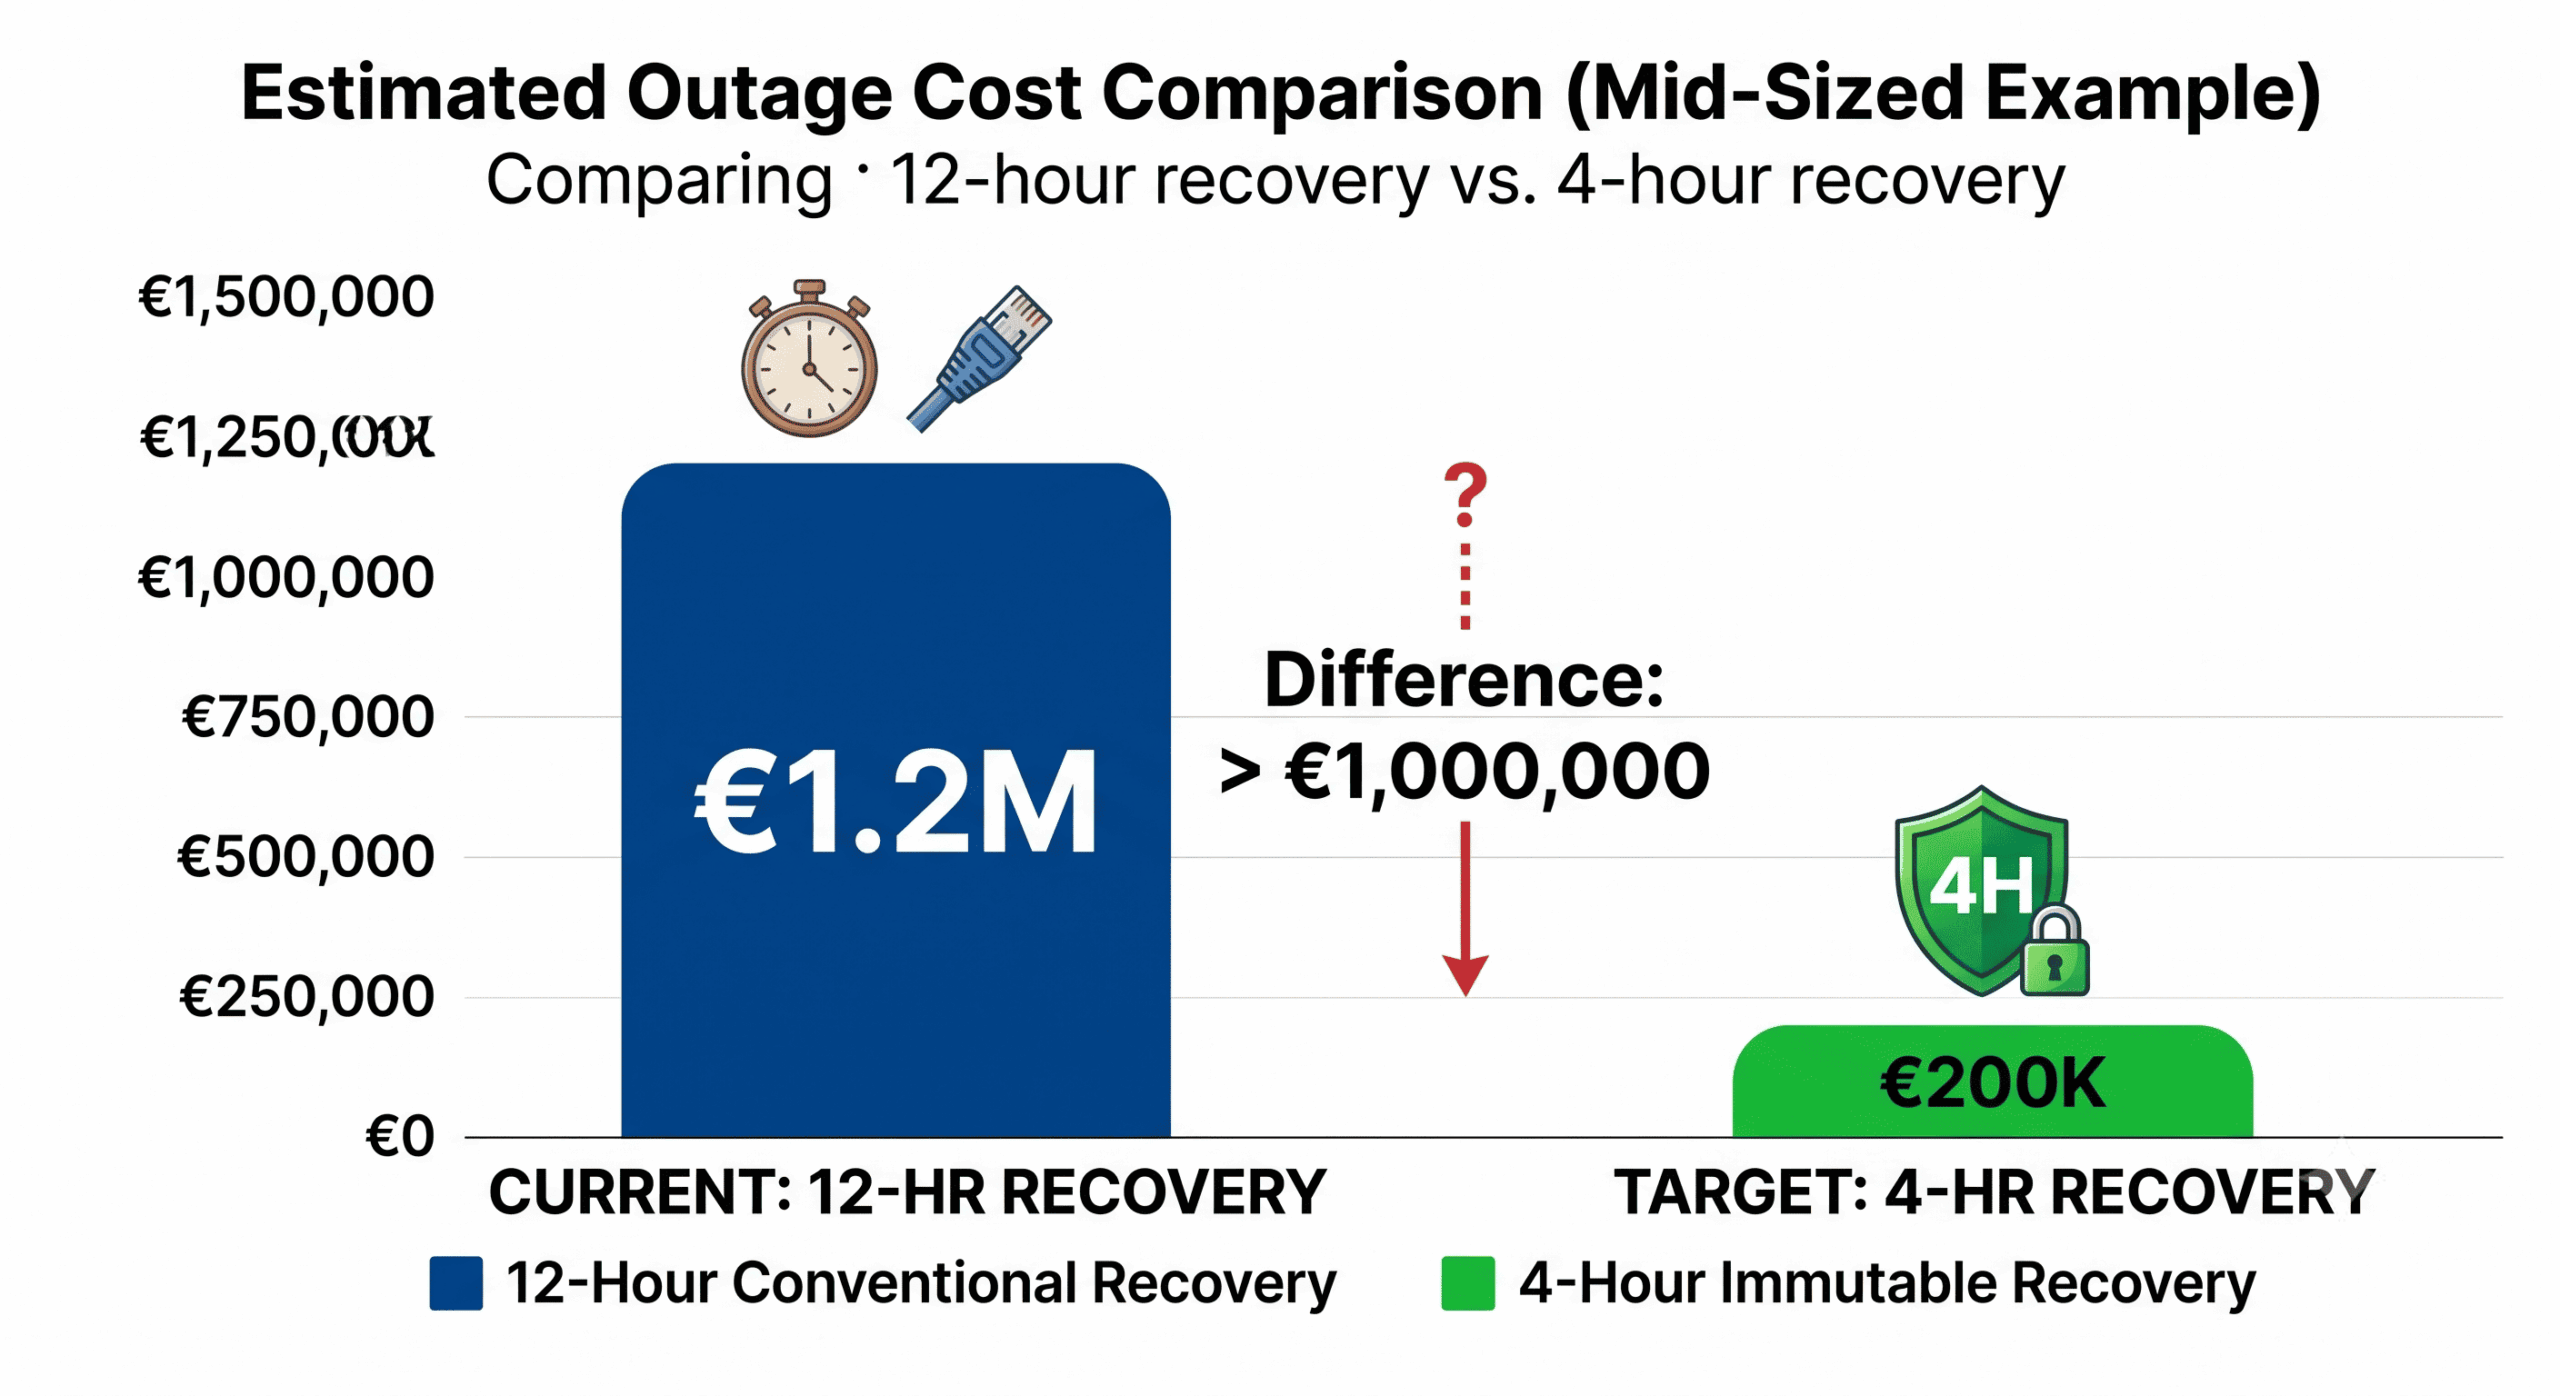
The two bottom rows are the argument: the difference between a 24-hour and a 4-hour recovery, for this mid-sized example, exceeds EUR1 million per incident - before any fine. Few IT investments have a cleaner financial justification than the one that moves you from the first row to the second.
Conclusion
Downtime cost stops being an abstraction the moment you multiply your own revenue per hour by a realistic recovery time - and for most organizations the result is uncomfortably large and remarkably sensitive to RTO. That sensitivity is good news: recovery time is buyable, through immutable backups, tested restore procedures, and disaster recovery that has been rehearsed rather than hoped for. Build the model, put your real numbers in it, and let the board see the gap priced in euros. If you'd like an independent review of your current recovery capability - or a downtime model built on your actual figures - we're glad to help.
Frequently Asked Questions
How do I calculate revenue per hour of downtime?
Divide annual revenue by annual operating hours for the baseline - a EUR50 million business operating 250 days at 10 hours per day loses roughly EUR20,000 per hour - then apply a 1.5x to 2x multiplier for peak trading windows. Add idle payroll (affected employees x loaded hourly rate) and any contractual SLA credits to get the full hourly figure. The result should be sourced from Finance's own numbers so the model survives CFO scrutiny.
What is the difference between RTO and RPO in financial terms?
RTO (recovery time objective) is how long systems stay down, so it multiplies duration-based costs: lost revenue, idle staff, SLA penalties. RPO (recovery point objective) is how much data is lost, so it drives severity-based costs: manual reconstruction of transactions, GDPR reporting obligations, and regulatory exposure when personal data is affected. Model them separately - an incident can have an acceptable RTO and a disastrous RPO, or the reverse.
How often should a downtime cost model be updated?
At least annually, and after every continuity drill or real incident. Update revenue and staffing inputs as the business changes, adjust SLA assumptions when contracts change, and - most importantly - replace assumed recovery times with measured ones from each drill. A model fed with real performance data compounds in credibility, while a static two-year-old spreadsheet reads as theater to both boards and auditors.